


Posted: 6/27/2010 12:46:16 PM EDT
|
I am writing an essay about protecting the Second Amendment and I need to incorporate
two visuals. They can be graphs, statistics or illustrations. I thought I would make a graph that shows the increase in violent crime when restrictions are placed on gun ownership using Chicago, D.C., Britain, Australia and Canada as examples, but I am drawing a blank for the second visual. Any ideas would be appreciated. |
|
You could point out how many "middle/working class, average Joe" people make their living from firearms (manufacture, sales, transport, accessories, ranges, training instructors, etc). You could point out how many are just average working families, and how they are negatively impacted by having their products banned and over-regulated.
Lots of people are all for banning an evil weapon but they pause for a minute when confronted with the fact that they're supporting the removal of their middle and working class neighbors John and Cindy's livelihood and ability to feed and clothe their kids. Firearms are just another product, only they're a product that hundreds of thousands of "regular" people base their source of income on. Legislation has consequences far beyond emotional knee-jerk "protect the children." A big colorful graph showing what percentage of the "average family guy" population would be unemployed as a result of various proposed and real bans might provide a startling visual. You could also do a comparison of how much taxpayer money is expended on programs (like CoBIS) as compared to how many crimes such programs have actually helped solve (last I checked I believe CoBIS was at an impressive 0 crimes solved). This could help underscore how much money is wasted on programs that actually do very little or nothing at all. Comparing the crime rate to gun owner ratio in this country to other countries with gun bans also always makes a good visual point. Not sure the details and direction of your project to know which types of graphs would be most relevant. |
|
Quoted:
You could point out how many "middle/working class, average Joe" people make their living from firearms (manufacture, sales, transport, accessories, ranges, training instructors, etc). You could point out how many are just average working families, and how they are negatively impacted by having their products banned and over-regulated. Lots of people are all for banning an evil weapon but they pause for a minute when confronted with the fact that they're supporting the removal of their middle and working class neighbors John and Cindy's livelihood and ability to feed and clothe their kids. Firearms are just another product, only they're a product that hundreds of thousands of "regular" people base their source of income on. Legislation has consequences far beyond emotional knee-jerk "protect the children." A big colorful graph showing what percentage of the "average family guy" population would be unemployed as a result of various proposed and real bans might provide a startling visual. You could also do a comparison of how much taxpayer money is expended on programs (like CoBIS) as compared to how many crimes such programs have actually helped solve (last I checked I believe CoBIS was at an impressive 0 crimes solved). This could help underscore how much money is wasted on programs that actually do very little or nothing at all. Comparing the crime rate to gun owner ratio in this country to other countries with gun bans also always makes a good visual point. LearningToLive, These are all great ideas! The focus of my report is that gun control does not reduce violent crime. I love how your examples not only hit the reader emotionally but in the pocketbook as well. Not sure the details and direction of your project to know which types of graphs would be most relevant. |
|
Quoted: Quoted: How about firearms seized in cities/States that ban them? In other words, the unthinkable - you can't make them disappear by banning them. I have information about this in my writing, but I can't find a way to make it a visual. How about this: Impossible, they were banned.  |
|
Quoted:
Quoted:
Quoted:
How about firearms seized in cities/States that ban them? In other words, the unthinkable - you can't make them disappear by banning them. I have information about this in my writing, but I can't find a way to make it a visual. How about this: Impossible, they were banned. http://www.chicagobreakingnews.com/Guns612.jpg they even got a crappy plastic crossbow in that one 
|
|
Quoted:
Quoted:
How about firearms seized in cities/States that ban them? In other words, the unthinkable - you can't make them disappear by banning them. I have information about this in my writing, but I can't find a way to make it a visual. You could list known areas that have bans, and then make a bar graph showing how many guns are seized annually in relation to a crime in each of those areas. Quoted:
LearningToLive, These are all great ideas! The focus of my report is that gun control does not reduce violent crime. I love how your examples not only hit the reader emotionally but in the pocketbook as well. Glad you like them. I'm not sure how you could use this in a visual, but if you haven't already, you might want to point out in your paper that Columbine––perhaps one of the most oft-referenced acts of gun violence by the "Something must be done!" crowd––occurred right in the middle of the AWB. Most of the guns they used were in direct violation of the AWB (and NFA, if I'm remembering correctly). So there were laws, and they did jack to prevent anything. |
| Oh, you could also do before and after graphs. Show the violent crime statistics before a gun ban takes place and after a gun ban takes place. Also show the difference before a gun ban is removed and after a gun ban is removed. In most cases, violent crime either stays relatively steady or is lower when there isn't a ban. I think it was Georgia, maybe? that recently repealed a gun ban on mass transit. If I'm remembering correctly, the antis predicted blood in the streets as a result of the repeal, but violent crime stayed relatively stable and might have even dropped a bit. |
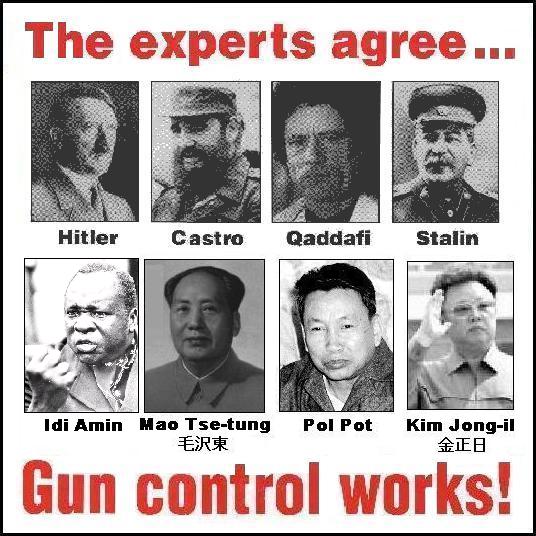
I'd be tempted to discuss the correlation between disarming citizens and oppressing them.

"Citizens! Turn in your weapons" by Bolshevik propaganda artist Alexander Apsit, circa 1918 Contemporary scholars have little explored the preconditions of genocide. Still less have they asked whether a society's weapons policy might be one of the institutional arrangements that contributes to the probability of its government engaging in some of the more extreme varieties of outrage. Though it is a long step between being disarmed and being murdered—one does not usually lead to the other— it is nevertheless an arresting reality that not one of the principal genocides of the twentieth century, and there have been dozens, has been inflicted on a population that was armed. — Daniel D. Polsby, Washington University Law Quarterly, Volume 73, Number 3, Fall 1997
When the history of the 20th century is finally written, one of its key features will be the wanton slaughter of more than 170 million people, not in war, but by their own government. The governments that led in this slaughter are the former USSR (65 million) and the Peoples Republic of China (35-40 million). The point to remember is that these governments were the idols of America's leftists. Part of the reason for these and other tyrannical successes was because the people were first disarmed. — Walter E. Williams, Professor of Economics at George Mason University
|