|
[#1]
PowerBI?
|
|
|
|
[#2]
Quoted: PowerBI? Bit of a higher learning curve compared to other MS products, but it will definitely get the job done. I pretty much live in it these days. |
|
|
|
[#3]
Powerbi looks interesting.
Wonder if it comes with my company 365 subscription. Can I use a data source that's not a SQL database? Like an excel sheet? |
|
|
|
[#4]
Quoted: Powerbi looks interesting. Wonder if it comes with my company 365 subscription. Can I use a data source that's not a SQL database? Like an excel sheet? Yep, two of our main reports are based on CSV file input. You have to tweak the query to get the import the way you want it, but it works just fine. ETA: I think PBI is still a free download |
|
|
|
[#5]
Just now playing around with it.
Question- If I want to do some "shading" vertically, or a plot band, on a line graph, can that be done? Like this: 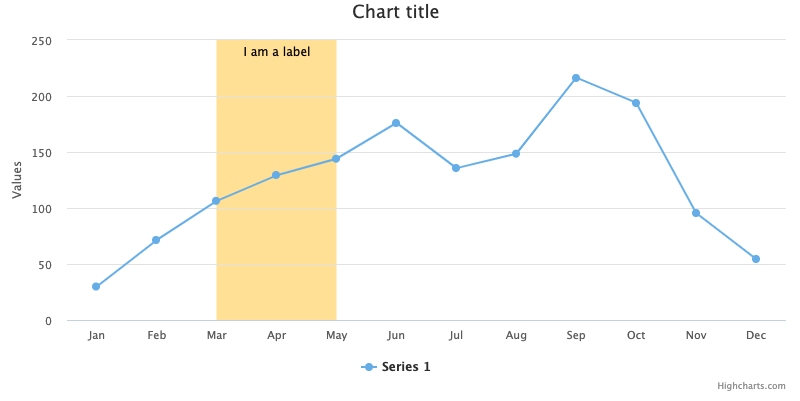
|
|
|
|
[#6]
Quoted: Just now playing around with it. Question- If I want to do some "shading" vertically, or a plot band, on a line graph, can that be done? Like this: https://www.highcharts.com/docs/chart-concepts/labels_in_plot_bands_and_lines.png Without being in front of it at the moment, I can't say "go here, click that" and show you how, but the answer is almost certainly yes. The visualization customizations are very robust. |
|
|
|
[#7]
Tableau is a pretty good visualization program, bit of a learning curve to it.
|
|
|
|
[#8]
Yeah, Tableau is pretty good but it’s expensive and their customer support sucks biggly.
|
|
|
|
[#9]
Pandas and Matplotlib are probably the most flexible tools to do what you want. Bit of a learning curve. Jupyter notebooks seem to be the most popular way to do it.
It's all free. |
|
|
|
[#10]
Quoted: Pandas and Matplotlib are probably the most flexible tools to do what you want. Bit of a learning curve. Jupyter notebooks seem to be the most popular way to do it. It's all free. Woo- thats somewhat more complex than I anticipated, but I think Python is sort of the next logical step for me. |
|
|
|
[#11]
Quoted: Woo- thats somewhat more complex than I anticipated, but I think Python is sort of the next logical step for me. Quoted: Quoted: Pandas and Matplotlib are probably the most flexible tools to do what you want. Bit of a learning curve. Jupyter notebooks seem to be the most popular way to do it. It's all free. Woo- thats somewhat more complex than I anticipated, but I think Python is sort of the next logical step for me. It’s easier than it looks - python has sort of become the non-programmer’s way to do computer stuff over the last few years. There’s a ton of material out there on visualization with Matplotlib and data manipulation with Pandas. |
|
|
|
[#12]
I would look at R (statistical analysis programming language that can crunch numbers or generate charts/graphs, etc) and either use it stand-alone or tie it in with any number of other programming languages (PHP, Perl, Python, Java, C/C++, etc). IIRC one of hte MS SQL versions even comes with R installed and ready to interact with it.
|
|
|
|
[#13]
I use DPlot for some of my work. It overlaps with Excel but then goes MUCH farther. It can be run as a stand-alone software package and can be used as an Excel Add-In.
DPlot |
|
|
 Win a FREE Membership!
Sign up for the ARFCOM weekly newsletter and be entered to win a free ARFCOM membership. One new winner* is announced every week!
You will receive an email every Friday morning featuring the latest chatter from the hottest topics, breaking news surrounding legislation, as well as exclusive deals only available to ARFCOM email subscribers.

AR15.COM is the world's largest firearm community and is a gathering place for firearm enthusiasts of all types.
From hunters and military members, to competition shooters and general firearm enthusiasts, we welcome anyone who values and respects the way of the firearm.

Subscribe to our monthly Newsletter to receive firearm news, product discounts from your favorite Industry Partners, and more.
Copyright © 1996-2024 AR15.COM LLC. All Rights Reserved.
Any use of this content without express written consent is prohibited.
AR15.Com reserves the right to overwrite or replace any affiliate, commercial, or monetizable links, posted by users, with our own.