|
Posted: 8/13/2020 12:04:38 PM EDT
I was wondering how you guys retain data from load tests. I am in the middle of a move so I won't have any time at the bench for a month or two and I thought I would organize the data I have. Currently, I am using an excel file that plots velocity vs charge weight on one axis and Std Dev vs charge weight on the other. I also plot ES over the velocity curve at the tested charge weights. I then include group size and add some pictures to the sheet. Below is a blank and filled in version of my template (anything in yellow represents missing data, it will change format with any data input).
  Finally, I load the best performing loads into a "master load data" file with some notes about the viability of the load and what I should try next. 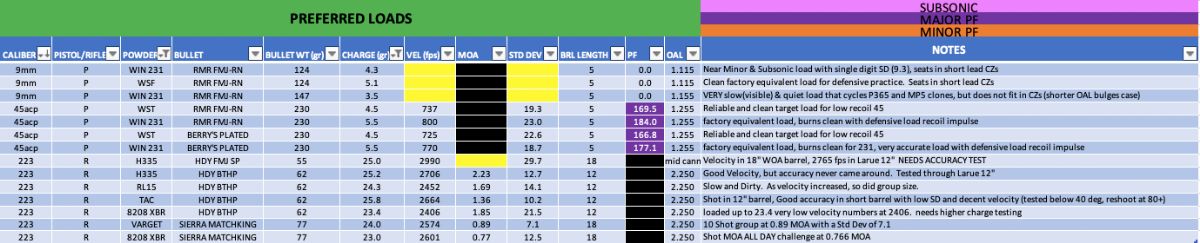 I was going to play around with my template and see if anything works better, but I was wondering if you had any advice or just a sleeker way to set it up. I know my way around excel enough to make it do what I want, but the difference between me and the guys that actually know what they are doing is that they usually have more elegant solutions to problems. I thought that with some input and a little help I might be able to put together an idiot-proof template that might work for new loaders looking to develop loads. As it stands now it updates all the graphs and calculations based on velocity inputs, but still requires input for load size. if I can get a good template together it should be as simple as inputting your 2,5, or 10 round velocity data, and reading the graphs. -Mike |
|
|
|
[#1]
Dude, i dont even know whats going on in your post, but i want it cause its got graphs and stuff!
 I sorta follow whats going on, just dont know what all the abbreviations stand for as im new. If you do get something figured out (hell, even if you dont) id be down for the template as i will be needing to develop loads soon as all my stuff is starting to arrive. |
|
|
|
[#2]
After decades of software development, training and use, I can tell you, unequivocally, there is no such thing as "idiot proof".
It is never as simple as. "...input velocity data." Velocity data might be a piece of the puzzle but might be the least important piece. Just because you have a chronograph does not make that the most important part of reloading. How about point of impact? How about pressure? How about OAL? How about case weight? There are so many others, too. Many times, it is a process of looking at the relationship between, by linking, this factor with that factor that one sees what's going on. This is where Excel shines. It makes it easy to look at those relationships in a quantitative way. "Hmmm,... what's going on THERE? That's not what I expected." |
|
|
|
[#3]
Quoted: After decades of software development, training and use, I can tell you, unequivocally, there is no such thing as "idiot proof". It is never as simple as. "...input velocity data." Velocity data might be a piece of the puzzle but might be the least important piece. Just because you have a chronograph does not make that the most important part of reloading. How about point of impact? How about pressure? How about OAL? How about case weight? There are so many others, too. Many times, it is a process of looking at the relationship between, by linking, this factor with that factor that one sees what's going on. This is where Excel shines. It makes it easy to look at those relationships in a quantitative way. "Hmmm,... what's going on THERE? That's not what I expected." I understand there are a lot of variables that aren't accounted for. What I am trying to figure out is how to record the variables that are worthwhile in the first stages of development. Everything cannot be accounted for and still be user friendly IMO. As far as the pressure I record any signs in the notes section unless you are proposing measuring pressure somehow. POI shift is roughly accounted for by posting a picture of the target (assuming we aren't doing anything stupid like adjusting elevation between loads) of course you could use a program that measures the distance from POI and include that info if wanted and get better data. OAL is written into the data up top but would require a different setup to account for the effect of varying OAL... of course for me that usually comes after I settle on a charge, which is what I am trying to get to with this sheet. I have actually repeated the same sheet for a different OAL on a couple of occasions after finding promising combinations. During load development, I would hope similar case weights are being used. Determining the effect of various case weights is simply a different exercise, no less valuable for sure, but this is further down the line from the initial load development. initially, I am going to do my best to remove that variable by using similar case weights or for plinking ammo at least the same headstamps. Additional sheets might be useful to capture the effects of case weight and OAL variation and shouldn't be hard to add. The graph focuses on velocity because it is the most easily quantifiable over charge weights, and lends itself to graphing. That said it is NOT the deciding factor, for me that is a combination of group size, ES, SD, and making sure I am not in the middle of a significant POI shift between charges. I want this to be as useful as possible, but I also don't want to let perfection become the enemy of progress. No single set of data will answer all questions, there is always more tweaking to be done in this hobby (temperatures, etc all change). But getting the most useful data for each load test is a worthwhile endeavor. I guess what I want is to figure out what people typically record when they grab their new load and sight in on the target. -Mike |
|
|
|
[#4]
I do data crunching for a living. This looks to be a good start and well beyond what most would do. Thoughts:
1) If you want to visualize the change in velocity and variation in one chart, you can use the new boxplot feature in excel. Still teething but good. 2) I would record all data as raw data in a db format. That means recording each shot. This allows you to pivot it and uncover all kinds of interesting relationships down the line. To calc ES though, that would mean recording each shot in terms of coordinates but that could be powerful also. |
|
|
|
[#5]
Quoted: I do data crunching for a living. This looks to be a good start and well beyond what most would do. Thoughts: 1) If you want to visualize the change in velocity and variation in one chart, you can use the new boxplot feature in excel. Still teething but good. 2) I would record all data as raw data in a db format. That means recording each shot. This allows you to pivot it and uncover all kinds of interesting relationships down the line. To calc ES though, that would mean recording each shot in terms of coordinates but that could be powerful also. I will play with boxplot for sure, that seems like it might better capture some data and work better than my solution of separately putting points for high and low velocities (ES) along the velocity curve. Recording each shot would be useful to see the shift from show 1,2,3 - 10. But I wonder if that would be a bit cumbersome. -Mike |
|
|
|
[#6]
Quoted: I do data crunching for a living. This looks to be a good start and well beyond what most would do. Thoughts: 1) If you want to visualize the change in velocity and variation in one chart, you can use the new boxplot feature in excel. Still teething but good. 2) I would record all data as raw data in a db format. That means recording each shot. This allows you to pivot it and uncover all kinds of interesting relationships down the line. To calc ES though, that would mean recording each shot in terms of coordinates but that could be powerful also. If data from a Labradar SD card could be imported as the data source, it would be even better. ;) |
|
|
|
[#7]
I wrote a little VBA routine that consolidates all my LR data. But haven’t done plotting on charts and things, at least not automated.
|
|
|
 Win a FREE Membership!
Sign up for the ARFCOM weekly newsletter and be entered to win a free ARFCOM membership. One new winner* is announced every week!
You will receive an email every Friday morning featuring the latest chatter from the hottest topics, breaking news surrounding legislation, as well as exclusive deals only available to ARFCOM email subscribers.

AR15.COM is the world's largest firearm community and is a gathering place for firearm enthusiasts of all types.
From hunters and military members, to competition shooters and general firearm enthusiasts, we welcome anyone who values and respects the way of the firearm.

Subscribe to our monthly Newsletter to receive firearm news, product discounts from your favorite Industry Partners, and more.
Copyright © 1996-2024 AR15.COM LLC. All Rights Reserved.
Any use of this content without express written consent is prohibited.
AR15.Com reserves the right to overwrite or replace any affiliate, commercial, or monetizable links, posted by users, with our own.